 Geographic Information Systems (GIS) have revolutionized how we collect, analyze, and visualize spatial data. By integrating location-based information with various datasets, GIS provides powerful tools for researchers, students, and faculty across multiple disciplines. Whether mapping disease outbreaks, analyzing environmental changes, or planning urban infrastructure, GIS offers insights critical for informed decision-making. Keep reading below to learn more about GIS, and don’t miss the details of our upcoming GIS Day celebration on Nov. 20th (10am-2pm in Lister Hill Library)—join us to explore innovative GIS applications, connect with enthusiasts, and discover how GIS can enhance your own work.
What is GIS?
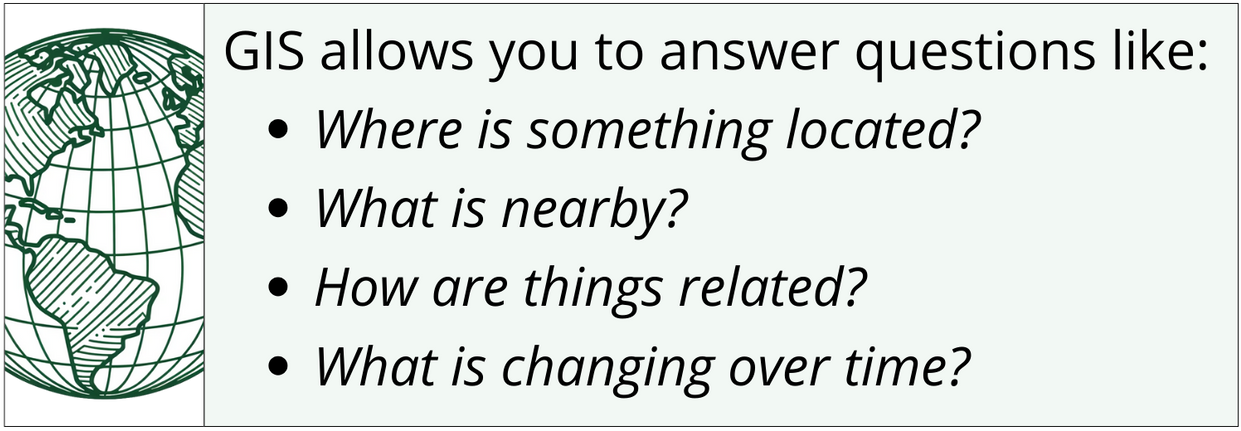
 A Geographic Information System (GIS) is a computer-based system that creates, manages, analyzes, and maps all types of data. GIS connects data to a map, integrating location data (where things are) with descriptive information (what things are like there). This integration provides a foundation for mapping and analysis used in science and almost every industry. GIS helps users understand patterns, relationships, and geographic context.
Why Use GIS?
 GIS enables visualization of large and complex datasets, revealing patterns and relationships that might be missed in traditional data analysis. It's not just about making maps; it's about understanding the world in a more dynamic and informed way. By organizing data into discrete layers aligned in geographic space, GIS allows for sophisticated spatial analyses. Visualization is critical for data integrity and understanding.
GIS in Research and Education
At institutions like the University of Alabama at Birmingham (UAB), GIS plays a pivotal role in advancing research and education. With access to comprehensive GIS tools and resources, researchers and students leverage spatial analysis to address complex challenges in health, environmental science, urban planning, disease surveillance, and more. See below for some examples of how GIS is being used.GIS in Action

Health Outcomes and Public Health Research
Investigators such as Dr. Elizabeth Baker, Associate Professor of Sociology and Co-Director of the Social Determinants of Health Core at UAB, utilize GIS to explore how area-level measures, such as environmental and socioeconomic indicators, impact health outcomes. By mapping data on factors like temperature, tree canopy coverage, and access to oncology providers, Dr. Baker and her team identify patterns that inform public health interventions.
Additionally, GIS is used to map environmental pollution, such as Superfund sites, in relation to disadvantaged neighborhoods. These visualizations are critical for understanding the impacts on community health and informing environmental justice initiatives.

Health Services Research
The UAB Heersink School of Medicine actively engages with GIS for various projects, such as drive-time analyses to assess patient access to HIV providers and identifying hotspots of chronic diseases like cardiac arrest in order to pinpoint areas needing targeted interventions.
Ariann Nassel, GIS expert and Director of Geospatial Data Visualization in the Lister Hill Center for Health Policy, has developed a series of interactive web mapping applications—also known as StoryMaps—to visualize pediatric hospital utilization across the United States for the Pediatric Pandemic Network. StoryMaps harness the power of maps to communicate narratives and incorporate various forms of media, easily shared using just a URL. By allowing users to explore demographic characteristics and health data at the zip code level, these tools enhance understanding of healthcare access and guide improvements in pediatric care.
The project was also a practical example of the impact of GIS visualization. While mapping patient data for a specific hospital, Nassel noticed the absence of patients from certain areas—a finding that seemed unlikely given the hospital's location. This anomaly prompted further investigation, leading to the discovery of data retrieval errors caused by misspelled county names. Without the visual insights provided by GIS, such critical errors might have gone unnoticed, potentially skewing research findings and affecting healthcare decisions.

Urban Planning and Community Well-being
Dr. Akhlaque Haque, Professor, UAB Department of Political Science and Public Administration, conducts extensive research on urban environments, focusing on the interplay between historical biases, environmental factors, and public health. Using GIS to analyze spatial patterns, his work integrates historical redlining maps with modern urban data to reveal how formerly redlined neighborhoods continue to face environmental challenges, such as limited access to green spaces and higher health risks. By mapping park accessibility and infrastructure, Dr. Haque assesses how these spaces influence health outcomes in urban areas, informing city planning and public policies aimed at enhancing overall community well-being.
Additionally, Dr. Haque’s research explores how emerging technologies like artificial intelligence (AI) and robotics in urban planning can perpetuate human biases if not carefully designed. By highlighting the potential of AI to enhance equitable urban planning when deployed responsibly, this research seeks to inform strategies to mitigate historical planning biases and improve community health outcomes.

GIS in Grant Applications
GIS is instrumental not only in research but also in grant writing. Researchers use GIS to visualize proposed target areas, such as census tracts associated with specific cities or counties or illustrate the prevalence of socioeconomic factors or environmental pollution. These visualizations strengthen grant proposals by providing clear, spatially informed evidence of need and potential impact. For instance, mapping drive times to healthcare facilities or areas with high disease incidence can highlight gaps in services and justify funding requests for targeted programs.
2024 GIS Day: Engage and Explore
 Mark your calendars for GIS Day on November 20th! Whether you're at UAB or part of the broader community, this in-person event is an excellent opportunity to engage with GIS enthusiasts and professionals.
Event Details:
- Date: November 20th
- Time: 10 AM to 2 PM
- Location: Lister Hill Library, 4th Floor Atrium, UAB Campus
- Highlights: A series of presentations featuring speakers demonstrating and discussing various GIS applications across disciplines. Lunch (pizza) provided! Open to all faculty, staff, and students.
Register now and join us to network, learn, and discover how GIS can enhance your work. More details about the upcoming 2024 GIS Day celebration are available here. Download a detailed event agenda here. Subscribe to the weekly CCTS Digest to stay informed of all upcoming CCTS events.
GIS Resources
The Center for Clinical and Translational Science (CCTS) Partner Network is a collaborative effort that extends resources and expertise across multiple institutions. While this article highlights resources available at UAB, many GIS tools and training opportunities are accessible to all members of the network and beyond. Researchers are encouraged to explore GIS capabilities within their own institutions and through shared resources
For those affiliated with UAB:
- Access to ArcGIS Software: UAB holds an institutional license for Esri's ArcGIS software suite, providing unlimited access for educational and research use. This includes desktop applications like ArcGIS Pro and web-based tools such as ArcGIS Online.
- Geospatial Research and Information Domain (GRID): GRID offers support and resources for incorporating GIS into your work, including training, consultation, and access to datasets. Visit the GRID StoryMap for guidance on getting started.
- UAB Social Determinants of Health Core
- UAB GIS contact: Ariann Nassel, Director of Geospatial Data Visualization
- email:
This email address is being protected from spambots. You need JavaScript enabled to view it. For those outside UAB:
- Check institutional resources: Verify if your institution has an Esri GIS license. Many universities and organizations have licenses that provide access to GIS software and tools.
- Sign up for a free public account: If institutional resources are not available, you can sign up for a free public account with ArcGIS Online. This account provides access to basic GIS functionalities and is a great starting point. Register at ArcGIS Public Account Sign-Up.
- Explore free training opportunities: Esri offers free online training modules that are accessible to anyone. These courses cover a wide range of topics, from GIS fundamentals to advanced spatial analysis. Browse the catalog at Esri Training Resources.
