Title: When should early screening for gestational diabetes occur?
Authors: Lorie M. Harper, MD, MSCI1,2; Yumo Xue1,2, Jeffrey Szychowski, PhD1,2, Methodius Tuuli, MD, MPH3 Erika Werner, MD4 Jerrie Refuerzo, MD,5 Miriam Kupperman, PhD, MPH,6 Alan Tita, MD, PhD1,2,
Institution: 1 Center for Women’s Reproductive Health, University of Alabama at Birmingham, 2Department of Obstetrics and Gynecology, University of Alabama at Birmingham, 3Indiana University, 4Women and Infants of Rhode Island; 5The University of Texas Health Science Center at Houston; 6University of California, San Francisco
Background:
- Early screening for pregestational type 2 diabetes or early onset gestational diabetes is recommended by ACOG for overweight and obese women with an additional risk factor for type 2 diabetes
- Timing of early screening varies:
-
- First prenatal visit
- <14 weeks
- <16 weeks
- <20 weeks
- Insulin resistance increases throughout pregnancy
- Identification of gestational diabetes through glucose load testing may vary by gestational age performed due to physiologic changes in insulin resistance with advancing gestation
Objective:
Describe the impact of advancing gestational age on glucose challenge test results and the diagnosis of gestational diabetes between 14-22 weeks
Study Design:
- Secondary analysis of a multicenter randomized controlled trial of obese women with singleton non-anomalous gestations comparing early (14-20 wk) to routine (24-28 wk) screening for GDM
- Exclusion criteria: pregestational diabetes, major medical illness, bariatric surgery, or previous cesarean
- Screening was accomplished with a 50-g one hour glucose challenge test (GCT)
- Diagnostic testing with a 100-g, three-hour glucose tolerance test was performed if the GCT ≥135 mg/dL
- Gestational diabetes diagnosed with Carpenter-Coustan criteria
- Exposure was defined as the timing of early screening stratified into two week blocks: 14-15.9, 16-17.9, 18-18.9, and 20-21.9 wks
- The primary outcome was defined as the GCT value
- Secondary outcomes: Incidence of GCT≥135 mg/dL, incidence of gestational diabetes diagnosed <24 weeks, gestational age at diagnosis of GDM, composite adverse perinatal outcome (birth weight >4000 g, primary cesarean, pregnancy induced hypertension, shoulder dystocia, neonatal hyperbilirubinemia, neonatal hypoglycemia)
- Secondary analysis performed to compare the incidence of the composite adverse perinatal outcome in women undergoing routine screening (24-28 weeks) and each early screening stratum
- Baseline characteristics and outcomes were compared with a Student’s t-test, chi-squared test, or chi-squared test for trend, as appropriate
Results:
- 390 (45.5%) of 857 women underwent early screening 14-21.9 weeks
- Strata were similar in age, race, BMI, and HbA1c (Table 1)
- Women screened earlier were more likely to have hypertension (p=0.03)
- GCT value, GDM diagnosis <24 weeks, and gestational age at diagnosis of GDM did not change by timing of early screen (Table 2).
- Incidence of the primary outcome did not change by timing of early screen (Table 2)
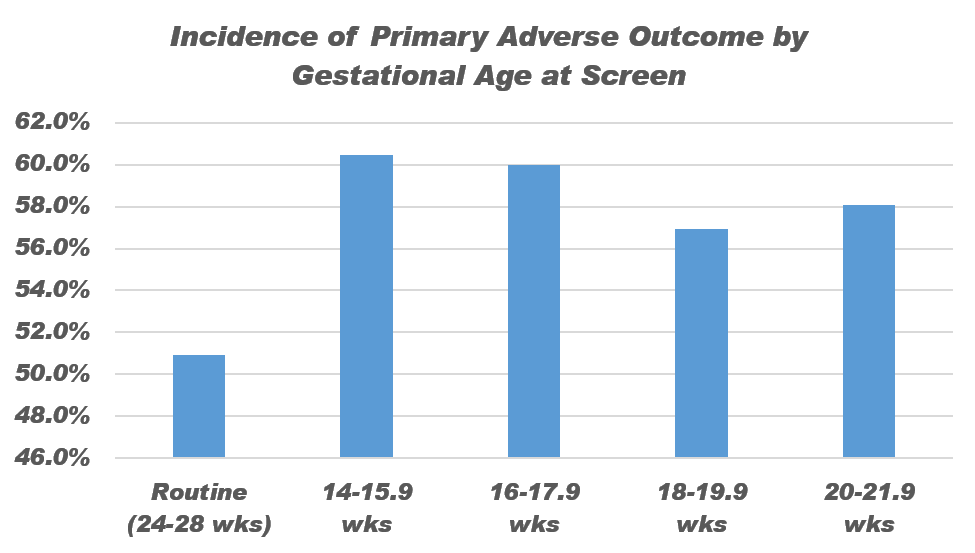
- No timing of early screening was associated with a decrease in the primary composite outcome compared to routine screening (Figure 1)
Conclusion:
Between 14-21.9 weeks, timing of early GDM screen did not impact screening and diagnosis values, nor did it impact the effect of treatment at current screening and diagnosis thresholds.
Table 1
|
Variable |
14-15.9 weeks 86 (22.1%) |
16-17.9 weeks 150 (38.5%) |
18-19.9 weeks 123 (31.5%) |
20-21.9 weeks 31 (8.0%) |
p |
|
Age (years) |
27.8 5.8 |
27.9 6.0 |
26.9 6.3 |
26.7 5.9 |
0.45 |
|
Race/Ethnicity |
22.1% |
38.5% |
31.5% |
8.0% |
0.50 |
|
White, non-Hispanic |
11.6% |
11.3% |
14.6% |
3.2% |
|
|
Black, non-Hispanic |
53.50% |
62.0% |
51.2% |
74.2% |
|
|
Native American |
0% |
0.7% |
0.8% |
0% |
|
|
Asian |
0% |
0% |
0.8% |
0% |
|
|
Hispanic |
34.9% |
26.0% |
32.5% |
22.6% |
|
|
BMI at Randomization (kg/m2) |
37.5 7.0 |
38.1 7.1 |
36.2 6.1 |
37.7 6.7 |
0.16 |
|
Medicaid/No Insurance |
96.5% |
98.7% |
95.9% |
96.8% |
0.56 |
|
Married |
18.6% |
24.0% |
22.8% |
22.6% |
0.81 |
|
Parous |
76.7% |
72.7% |
65.0% |
80.7% |
0.17 |
|
Any Smoking (%) |
18.6% |
18.0% |
15.5% |
22.6% |
0.80 |
|
Hypertension |
19.8% |
17.3% |
7.3% |
9.7% |
0.03 |
|
Hemoglobin A1c at 14-20 weeks (%) |
5.3 ± 0.5 |
5.3 ± 0.5 |
5.2 ± 0.6 |
5.4 ± 0.4 |
0.44 |
Table 2
|
Outcome |
14-15.9 weeks |
16-17.9 weeks |
18-19.9 weeks |
20-21.9 weeks |
P (trend) |
|
GCT Value |
123.7 25.9 |
121.9 25.9 |
121.6 31.7 |
127.1 40.7 |
0.78 |
|
GCT>=135 mg/dL |
32.6% |
28.0% |
30.4% |
29.0% |
0.76 |
|
GDM Diagnosis <24 weeks |
7.0% |
9.3% |
6.5% |
6.5% |
0.73 |
|
GA at Diagnosis of GDM |
22.9 5.3 |
26.7 5.3 |
25.35.1 |
26.44.3 |
0.41 |
|
Adverse Composite Perinatal Outcome |
60.5% |
60.0% |
56.9% |
58.1% |
0.61 |
|
Macrosomia |
3.5% |
6.1% |
8.3% |
3.2% |
0.45 |
|
Primary Cesarean |
17.4% |
18.7% |
22.0% |
16.1% |
0.67 |
|
Gestational Hypertension |
17.4% |
21.3% |
9.8% |
12.9% |
0.09 |
|
Preeclampsia |
|
|
|
|
|
|
Without Severe Features |
7% |
7.3% |
6.5% |
9.7% |
0.84 |
|
With Severe Features |
11.6% |
4.7% |
4.9% |
6.5% |
0.14 |
|
Hyperbilirubinemia |
23.3% |
19.3% |
20.3% |
22.6% |
0.83 |
|
Shoulder Dystocia |
8.1% |
5.3% |
6.5% |
3.3% |
0.48 |
|
Neonatal Hypoglycemia |
3.5% |
5.3% |
8.1% |
3.2% |
0.40 |
Figure 1